Data Visualization and Charting App
Industry
Trading
Location
USA
Partnership period
2021 – Ongoing
Team size
6
Project information
Overview
The client is the owner of an advanced analytical solution for businesses in different industries. The tool is accessible via a web browser. It enables the opportunity to turn raw data into valuable insights.
Our specialist has developed, tested, and released an iOS app that supports all the Apple UI features. Our team also developed Android, Flutter, and React Native applications to spread the platform’s functionality to other mobile platforms.
CodeIT has re-engineered the existing JS bridge and SDK to connect the charting library with the developed applications.
Our Task
CodeIT was hired to create an iOS mobile application. Also, our team was requested to create a reliable solution to deliver all the system’s functionality on portable Apple devices. We had to enable continuous two-way communication between tools that use different technologies.
As per the client’s request, the mobile application should have been available to download for free using demo data. Once a user purchases a license, they can adjust the app’s functionality and upload custom data sets to extract insights their businesses need.
Project Goal
The client wanted to spread its charting solution to different platforms. Meanwhile, they wanted to eliminate the need to create new financial charting libraries for every targeted platform from scratch.
CodeIT was hired to design and implement a solution that foresees the opportunity to use one codebase to deliver the functionality of the charting tool to many platforms.
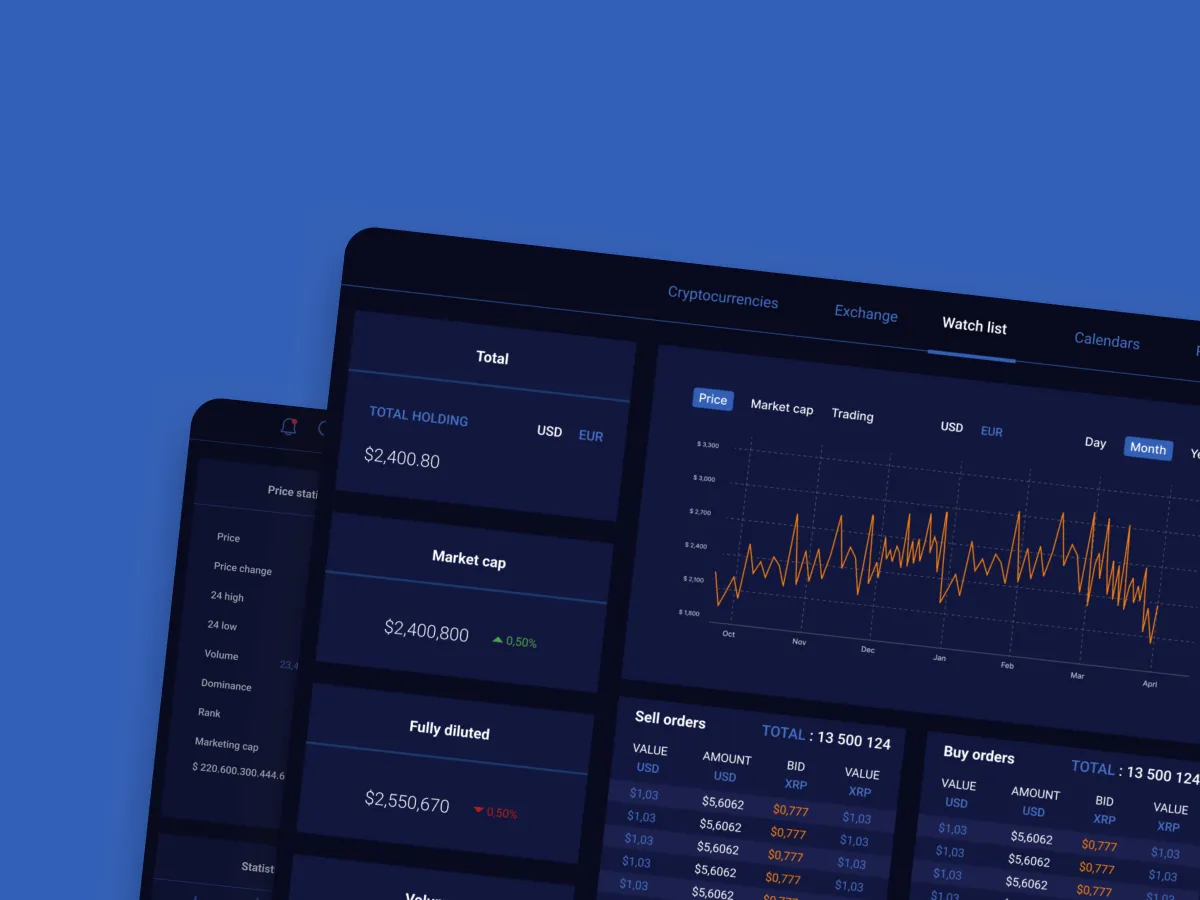
Existing Web Solution
The charting tool is an HTML5 library. It can run in a web browser. It enables users to analyze datasets, forecast price changes, draw, compare multiple charts, etc.
Challenges
Demo and Full Functionality
The iOS application had to deliver access to all the core functionality using sample data only. The ability to upload custom data sets and adjust the functionality of the app is enabled when clients purchase a license.
Charting Solution Integration
Clients who purchase the license need to be capable of integrating the charting solution into their applications and enhancing their functionality with ease.
Insufficiency Existing Solution
The existing technological solution was poorly designed. It couldn’t properly handle requests and deliver data from the JavaScrip library to the existing mobile app.
Live-Time Connectivity
The data analysis is performed on the server side by the JavaScript library. Therefore, developing continuous two-way communication between an iOS app and the JS library was vital. The data had to be exchanged in live time to deliver the data analysis functionality from the JS library to end users’ smartphones without delay.
App Store Publication
The existing iOS app didn’t match top-quality software standards. Moreover, it didn’t match Apple’s human interface guidelines. Hence, it wasn’t approved for publication in the Apple App Store.

Have a business challenge? Let’s solve it!

Business First
Code Next
Let’s talk
Implementation
The project involved many crucial stages that helped turn a usability-challenged solution into a fully functional app published on the Apple App Store.

Existing solution analysis
Our team has initiated the project and started examining the existing solution. The thorough analysis of the existing technological solution helped our team define the scope of work. We’ve decomposed the major tasks and prepared a detailed software developer plan.

SDK re-engineering
Up to 80% of the code was created from scratch, keeping only the core functionality of the existing JS bridge and SDK.
The re-engineering has enabled the opportunity to create a new application that seamlessly exchanges data with the JS library to deliver data analysis functionality to smartphones.

UI/UX design creation
A CodeIT specialist has created a well-thought-out UX interface, following Apple’s human interface guidelines.
The new UI/UX design created by our expert can deliver the same functionality on Apple devices with different screen sizes. The developed UI/UX design support:
- Dark mode
- Landscape mode

iOS app development
The CodeIT iOS developer has established a test environment to create a prototype of a new app in shadow mode. He used open-source data and the demo JS library. After reviewing and accepting the prototype, our specialist has developed two new iOS applications from scratch.

QA and release
QA specialists conducted a comprehensive review of the application, identifying and reporting issues to the developers. The final mobile apps have been released and are now available on the App Store.

Maintenance
Our team is involved in the support and maintenance of the released applications, implementing minor tweaks. Also, CodeIT specialists keep developing and releasing new features to enrich the existing functionality.

Project extension
The client decided to extend the project after releasing the iOS app the CodeIT team has created. The goal was to provide the clients with access to their charting web library using diverse platforms.
Our team was requested to create a mobile application for the Android platform. Additionally, our team had to develop two cross-platform apps using the Flutter and React Native frameworks.
Applications developed
Demo Simulator App
We’ve established a new repository and developed the demo iOS app. The app was tested and submitted to the Apple App Store. It passed the review process and was successfully published in the Apple App Store. It can be installed on Apple devices for free.
Fully-Functional App
Our specialists have created a dedicated version of the application that becomes available to clients who purchase the license. The application enables users to upload custom datasets to turn raw data into insights.
The re-engineered SK enables clients to:
- Adjust the functionality of their ios apps
- Develop and implement new features
- Integrate charts into their applications
The CodeIT specialist has implemented validation rules to ensure that users can’t enter the wrong data. Additionally, the application works seamlessly on iPad.
Both applications were tested by the quality assurance specialist to release bug-free apps.
Features implemented
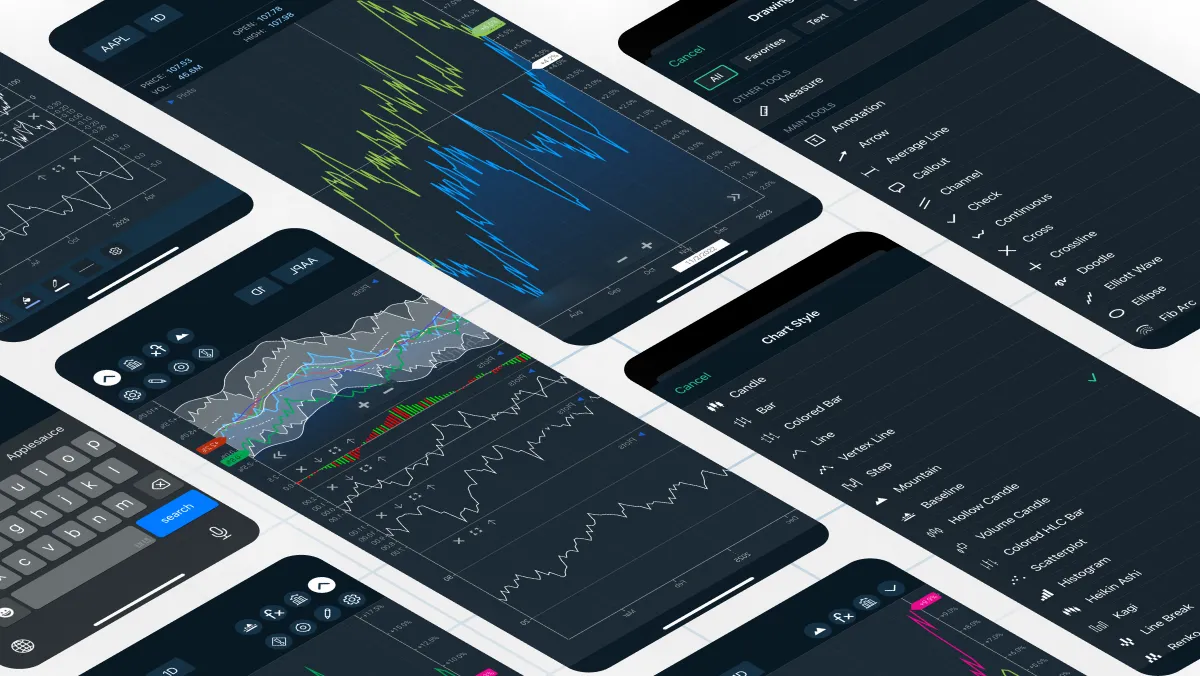
Drawing tool
It enables the opportunity to draw by putting elements that overlay charts. Up to 40 drawing elements are available. Some elements, like the Elliott wave, perform defined calculations of selected bars/points and show results in live time to facilitate chart analysis. Also, the drawing tool implies the measure feature to conveniently gauge the price difference.
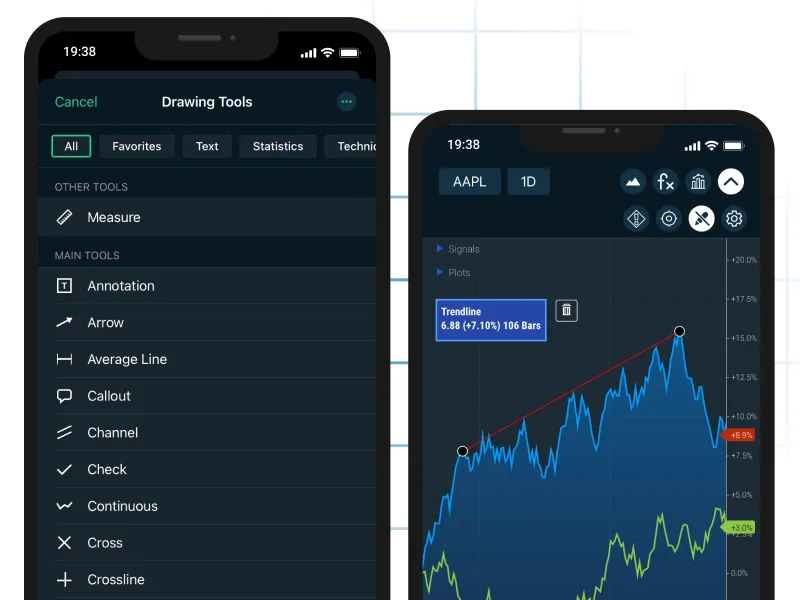
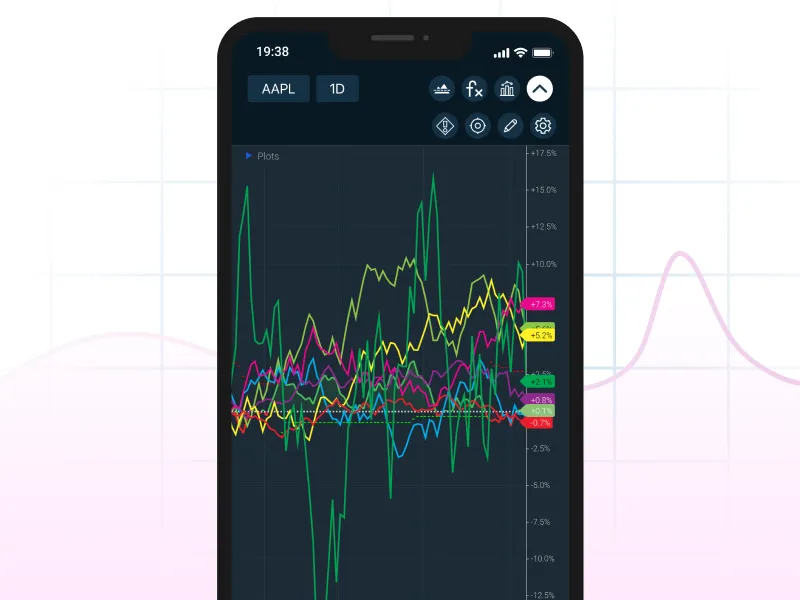
Chart comparison
The feature helps put several charts on one screen to compare them. The visual appearance of charts can be easily customized by users. The number of symbols that can be selected for comparison isn’t limited.
Analytical studies
Studies are pre-built data analysis algorithms. They analyze entered data and forecast stock price changes using various approaches.
There are more than 135 studies available to apply. Every selected study can be additionally configured to deliver the required forecasts. All the calculations are performed in live time, and results are delivered simultaneously.
Users can apply several forecasting studies at once. Predicted price changes are displayed by using a different color.
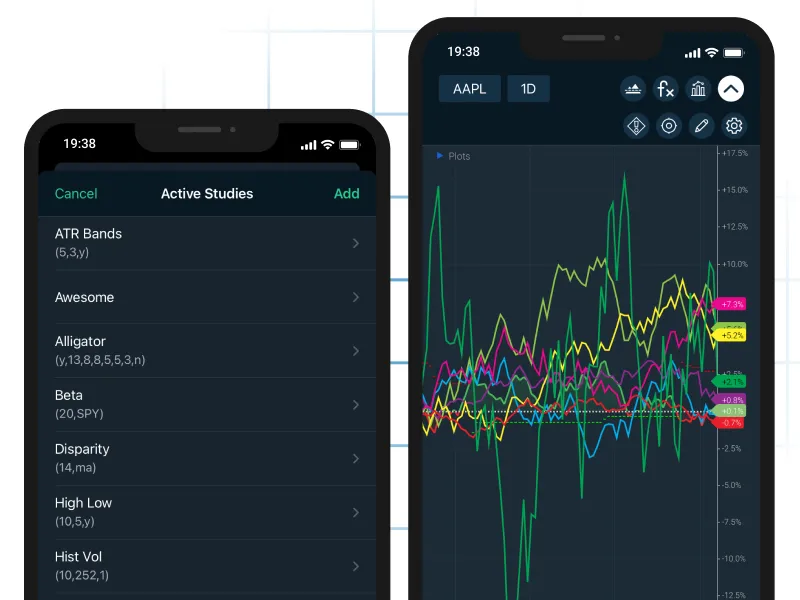
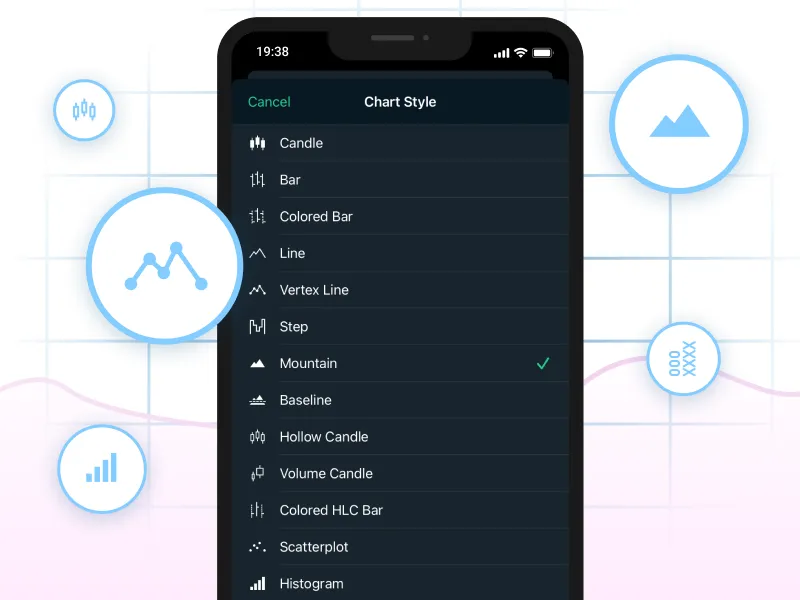
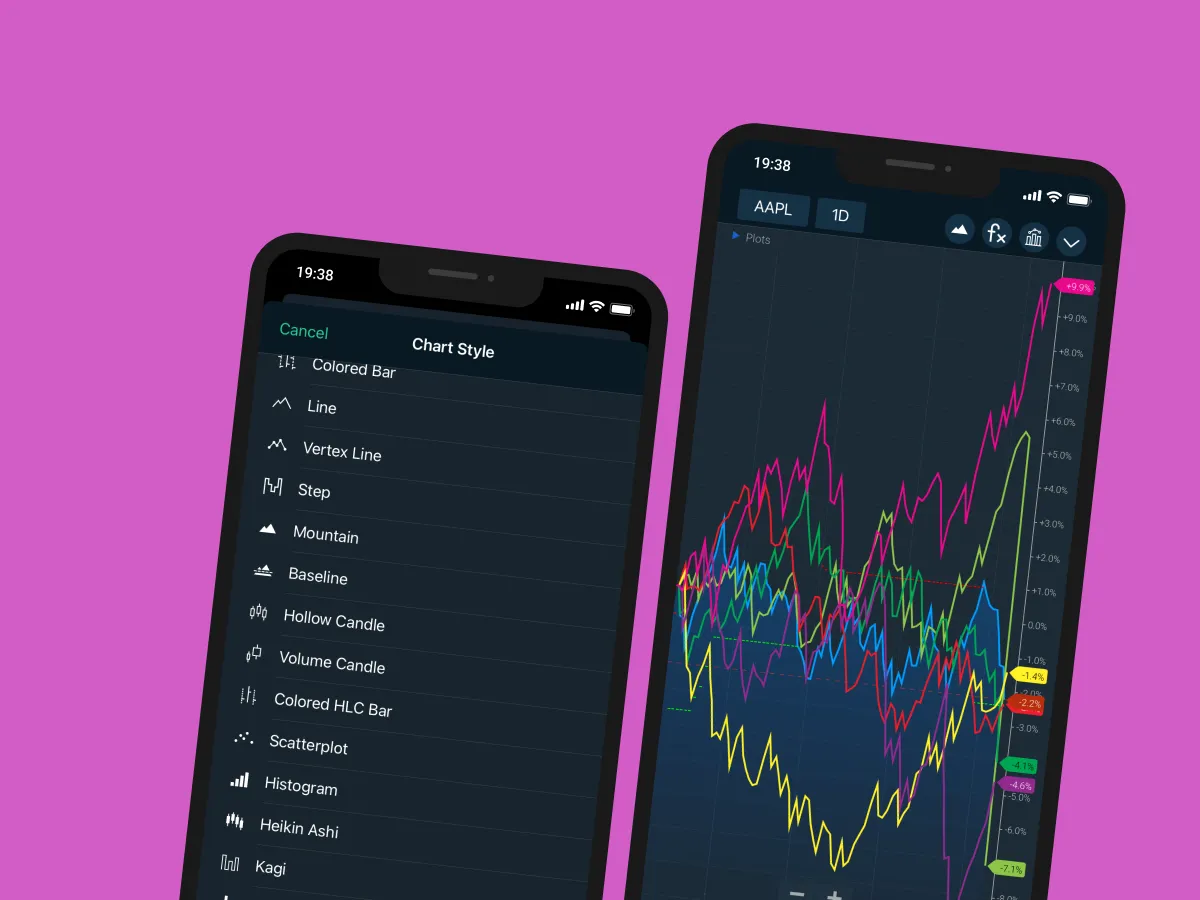
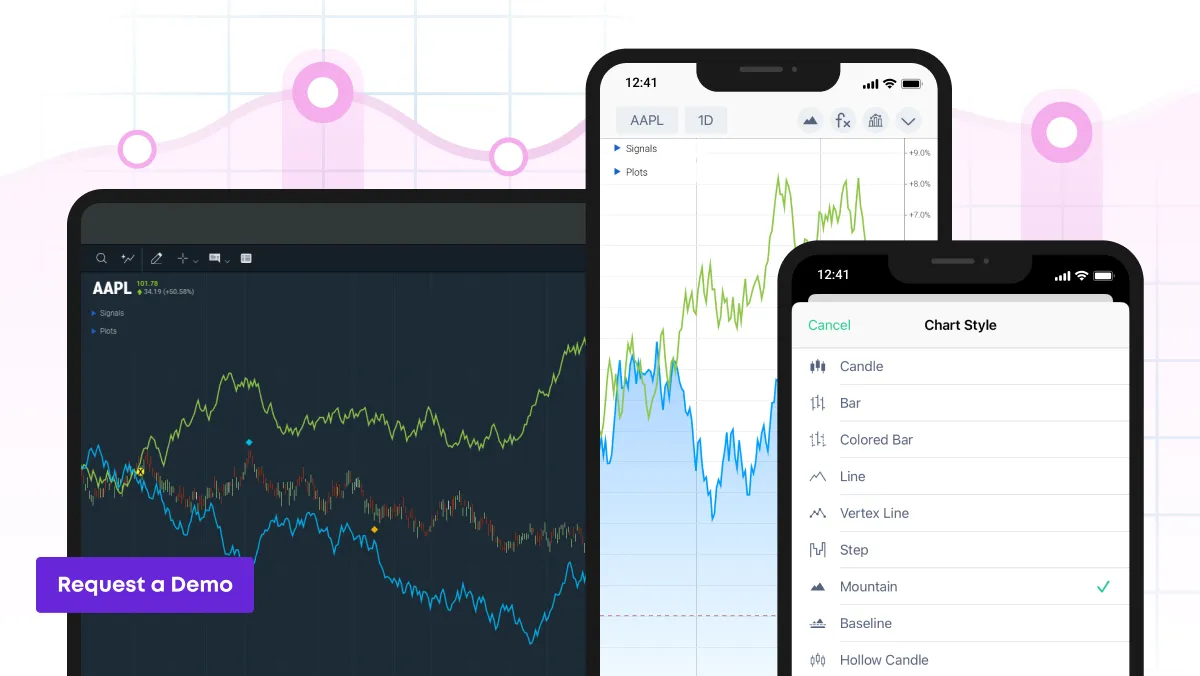
Chart styles
Users can easily change the visual representation of datasets by picking any of the 19 styles available, including candle, bar, line, and mountain. Chart styles can be selected from a drop-down list and can be applied with a click.
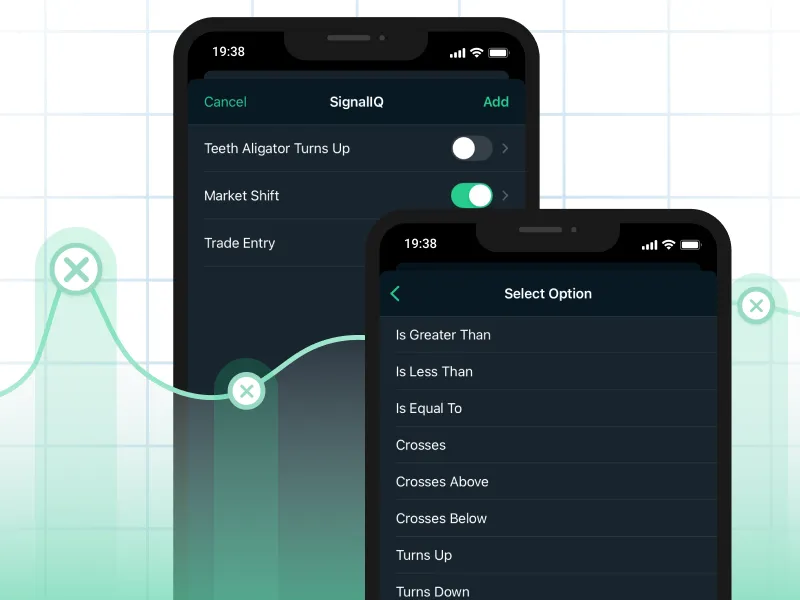
Signals
Signals are pre-programmed actions that help incorporate automation into the analysis of charts. Users can pick and configure actions that are initiated by the system when certain conditions are met.
Signals help define certain trading opportunities or risks. Multiple singles can be configured at once. Active signals are displayed on the workboard and can be enabled/disabled upon a click.
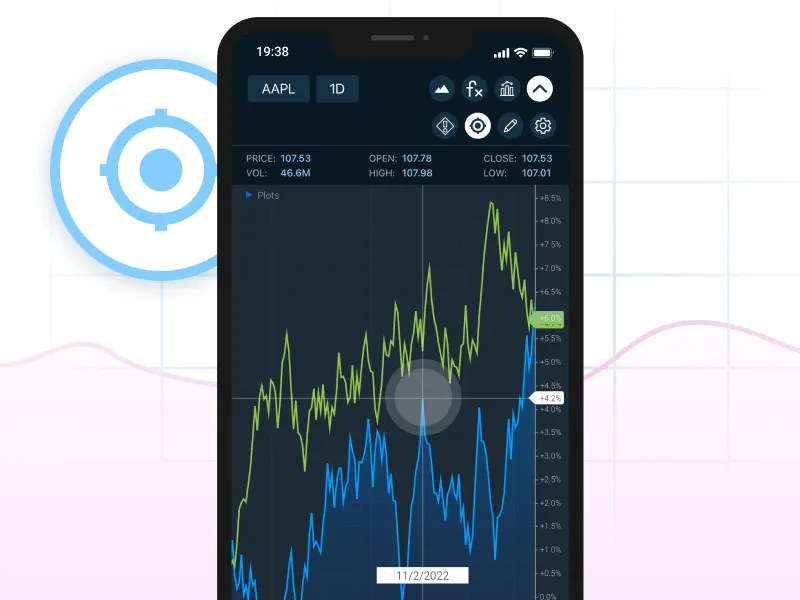
Crosshair
This tool helps users select a certain time on a workspace to check the price, including the open and close values. Also, the crosshair displays the market volume, including the high and low volumes. Displayed values change simultaneously when a user taps on another time area on a chart.
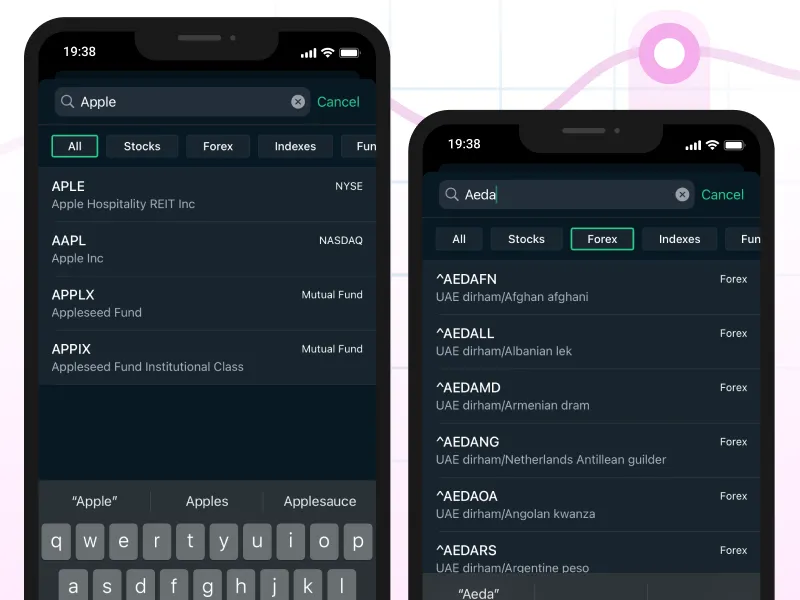
Stock search and update frequency
The search bar enables the opportunity for users to rapidly find stocks for further analysis. Using the app, they can adjust the data update intervals in a few clicks.
Result
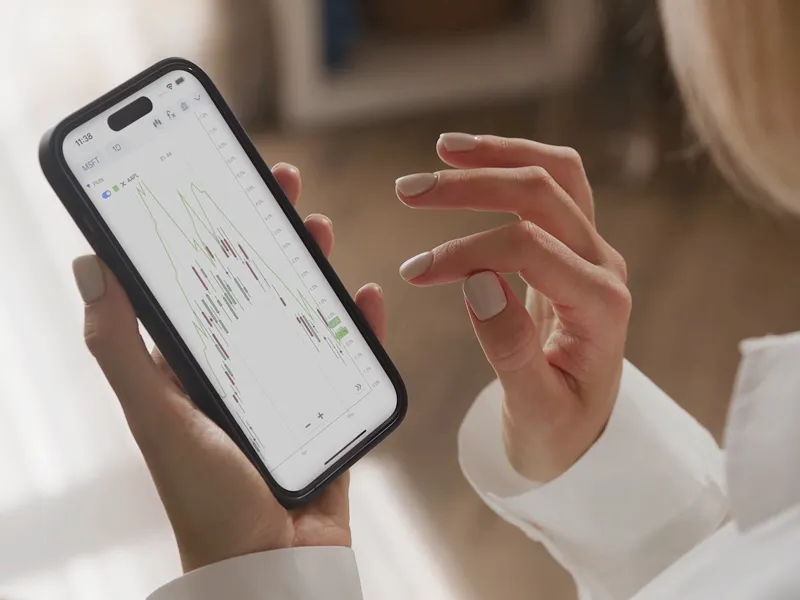
Cross-platform charting apps with real-time data integration.
The project’s outcome is the iOS, Android, Flutter, and React Native applications. They offer access to the advanced charting library. All the applications have been developed using native components to deliver outstanding performance, interface, and user experience.
In order to connect apps that use different technologies to the existing JS library, our specialist has re-engineered the existing JS bridge and SDK. It helped enable two-way connections between technological solutions that are built using different technologies.
Custom feature set? We will help
Business First
Code Next
Let’s talk
Project Details
- iOS Development
- Android Development
- Cross-Platform Development
- Project Management
- UI/UX Design
- Quality Assurance
- Web Development
- iOS developer
- UI/UX designer
- Quality assurance specialist
- 2 Android/Flutter developers
- Project Manager
- iOS (Swift)
- Android (Kotlin)
- React Native
- Flutter
Explore related services
iOS Development
Build mobile applications for Apple smartphones and tablets that deliver exceptional performance.
Android Development
Develop Android apps with full functionality and a feature set tailored to your business requirements.
Cross-Platform App Development
Save time and budget with cross-platform development using a single codebase for different platforms.
Quality Assurance
Run deep testing to guarantee your app works seamlessly in any environment.